I’ve been meaning to explore Tableau Prep for a while and finally took it for a test drive.
Many data professionals have experienced the need to prepare and clean data prior to analysis in tools like Tableau Desktop. Classic examples are: splitting data out of a single combined field; un-pivoting when each year of a measure is in a separate column; or maybe combining sales data from multiple differently formatted sources.
For me data preparation has usually been in our SQL Server / Data Warehouse environment, using SQL or enterprise integration and ETL tools like SSIS, WhereScape RED, or ADF & Databricks. For others it’s likely to have involved tidy up in Excel, a tool like EasyMorph, or even custom development in Python. But for analysts a number of these tools aren’t always accessible.
Tableau Prep is a tool that makes it easier and faster for analysts to combine, shape, and clean data for analysis within tools like Tableau. It provides a visual low-code environment for repeatable “flows” to get your data ship-shape. I’m often answering Tableau community forum questions with the comment that “yes you can do this in Desktop, but it would be easier in a data preparation stage”. Hence I’ve been keen to give it a go myself.
How did I get started? Three easy steps!
1. Downloaded Tableau Prep. You can download the free trial, then if you have a Creator license you can enter your license key. Chances are if you’re a Tableau Desktop user you have a Creator license.
-
Followed the Get Started with Tableau Prep Builder tutorial on the Tableau help site. I found that this took 1-2 hours, and was a nicely paced introduction to the UI and basic features. I like how it encouraged you to “give something a go” – there is always an undo button!
-
Completed the #PreppinData 2024 week 1 challenge. This took about 30 minutes as most of what I needed had been covered above!
PreppinData is one of the amazing projects that is run by, and for, Tableau community members. If you’ve participated in Makeover Monday, Workout Wednesday, Back to Viz Basics, or one of the other community projects, then the approach will be familiar to you. Each week the organisers post a challenge to social media and their site. The challenge comes with a currated input data set, some requirements for you to try in Tableau Prep (or other data prep tool of your choice), and the expected output. You can give the challenge a go, share you solution and see what other members of the community come up with. A great way to learn and practice!
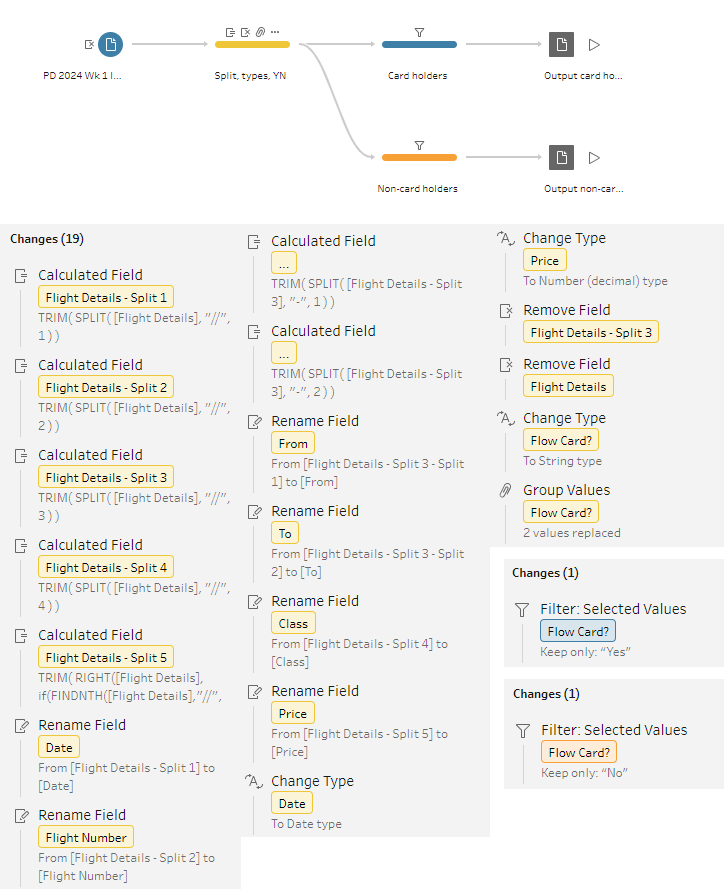
Week 1 challenge – tidy and split some fake airline loyalty card data into two files ready for analysis.
My solution:
– One clean step to: split out the combined field using two custom splits (Flight Details on //, From-To on -); remove now unecesary fields; rename and fix up data types; and replace 1/0 with Yes/No.
– Two clean steps to produce the two filtered lists (card holders and non-card holders).
– Two corresponding output steps to output the required CSV files.
Summary screenshot below. Impressions so far … loving the tool! So much neater and repeatable than a series of Excel sheets, and seemed more accessible for analysts than other tools I’ve used.